The Concentrated Position Playbook: The Advisor's Complete Toolkit for Single-Stock Clients
Seven tools, forty years of data, and the real costs nobody puts on the first slide. Strategy mechanics, provider economics, and the trade-offs behind every approach to a concentrated stock position.

Izzy
Founder and CEO
Part I: The problem, quantified
Every advisor has this client. The senior engineer whose RSUs became 70% of the household balance sheet. The founder whose Series A common is suddenly worth more than everything else she owns. The retiree who joined a utility in 1988, enrolled in the stock purchase plan, and never sold a share. They are different people with the same portfolio: one line item, an enormous embedded gain, and a polite refusal to do anything about it.
The refusal is not irrational. It is a tax bill with a story attached. Selling means writing a seven-figure check to the IRS for the privilege of exiting the very position that built the wealth. So the position sits, the concentration compounds, and the advisor's job becomes managing a risk the client will not name.
Before reaching for tools, it is worth being precise about how dangerous single-stock concentration actually is, because the data is far worse than most clients believe.
The three numbers to memorize:
- 4% of listed U.S. companies account for all net stock-market wealth creation since 1926. The other 96% collectively matched Treasury bills (Bessembinder, Journal of Financial Economics).
- Minus 54%: the median lifetime return of a Russell 3000 stock relative to the index since 1980 (J.P. Morgan, The Agony and the Ecstasy).
- 86 individual stocks produced half of all market wealth ever created. Statistically, your client does not hold one of them forever.
Figure 1. The base rates of holding one stock, Russell 3000 since 1980. Source: J.P. Morgan, The Agony and the Ecstasy, Part IV (2024).
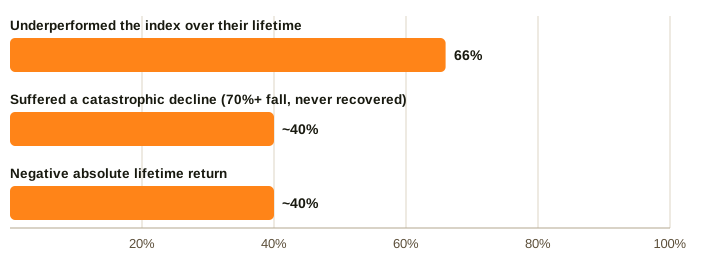
The J.P. Morgan study deserves to be quoted to clients directly, because it dismantles the two most common objections. "My company is profitable and well-run" fails because more than half of the catastrophic decliners were profitable at their peak, with low leverage. "The analysts love it" fails because analysts loved almost every one of them at the top. Moderna, PayPal, and Estee Lauder all joined the catastrophic-decline list in the most recent update.
Bessembinder's research completes the picture from the other direction. The equity risk premium that justifies owning stocks at all is generated by a vanishingly small number of extreme winners: about 1,092 companies, 4% of the total, account for every dollar of net wealth the U.S. stock market has created above Treasury bills since 1926. Holding one stock is not a concentrated bet on the equity premium. It is a lottery ticket whose expected value is dragged down by a fat left tail.
Concentration is how wealth gets built. Diversification is how it gets kept.
The market this creates
The supply of concentrated clients is growing structurally. Roughly 72% of companies now include RSUs in long-term incentive programs, up from about 47% a decade ago. The NCEO counts roughly 25 million U.S. employees in broad-based ownership programs, and 57% of public companies now offer an ESPP. For senior tech employees, vested and unvested equity commonly reaches 60-80% of household net worth within four to six years of joining.
Meanwhile U.S. household financial wealth passed $90 trillion at year-end 2024, with households above $5 million controlling roughly $49 trillion of it (Cerulli). A meaningful slice of that wealth is trapped in exactly the positions this guide is about: too large to ignore, too appreciated to sell.
The math of doing nothing (and of selling). Take the canonical case: a California client holding $5,000,000 of employer stock with a $500,000 basis. Selling it all today means a $4.5M gain taxed at roughly 37.1% all-in: about $1.67 million to the government, leaving ~$3.33M to reinvest. Holding it all means a roughly 40% historical chance the position eventually suffers a 70%+ unrecovered decline; a 70% drawdown on $5M is $3.5 million, more than double the tax bill the client is avoiding. Both numbers are large enough that the client freezes. Every tool in this guide exists to break that stalemate at a lower cost than either extreme.
Part II: The four-question framework
Every strategy in this guide answers a different combination of four questions. Run the client through them before touching any product, because the answers eliminate most of the toolkit immediately.
- Does the client need cash from this position? If yes: collars with monetization loans, prepaid variable forwards, staged sales, or a CRT income stream. If no: exchange funds, 351 ETFs, and long/short unwinds dominate; they diversify without distributing.
- Is there genuine charitable intent? If yes: CRTs, outright stock gifts, and donor-advised funds become the cheapest tools in the entire kit. If no: strike them. A CRT without charitable intent is an expensive annuity with an irrevocable regret clause.
- Is the client an insider or affiliate? Roughly 84% of large-caps prohibit executive hedging, so collars and PVFs are usually off the table by policy. Route to 10b5-1 plans, gifting, and pooled vehicles.
- What is the real time horizon? Multi-decade or "until death": deferral strategies convert to elimination via the basis step-up. Under ~5 years: lockups and slow unwinds mostly fail; the honest answer may be paying the tax.
One more principle before the tools: deferral is not elimination, except when it is. Almost everything below defers tax rather than erasing it. Deferral has real value, but its terminal value depends on the endgame. If the client will hold until death, IRC 1014's basis step-up converts every deferral strategy into permanent elimination, and the expected value of the entire toolkit roughly doubles. If the client will need the money in eight years, deferral is a loan from the IRS, not a gift. Establish the endgame first.Tool 01: Staged selling and 10b5-1 plans
The unglamorous baseline, and the benchmark every other tool must beat. Sell a fixed dollar amount or share count on a schedule, pay the tax as you go, and reinvest in a diversified portfolio. Its virtues are real: zero product cost, zero complexity, zero counterparty, immediate risk reduction, and full liquidity. Its cost is the tax drag, front-loaded exactly when the position is largest.
For insiders, the staged sale lives inside a Rule 10b5-1 plan, and the 2023 SEC amendments made these meaningfully stricter: directors and officers face a cooling-off period running to the later of 90 days after plan adoption or two business days after the next 10-Q or 10-K (in practice up to ~120 days), a good-faith requirement, certification of no material nonpublic information, limits on overlapping plans, one single-trade plan per 12 months, and quarterly issuer disclosure of plan adoptions and terminations. Affiliates also carry Rule 144 volume limits: sales in any three-month window capped at the greater of 1% of shares outstanding or the four-week average weekly volume.
When a client rejects staged selling, the objection is almost always the tax bill. The rest of this guide is a tour of the machinery that exists to answer that objection. Each machine charges rent. The advisor's job is to check, case by case, whether the rent is lower than the tax drag it avoids.
Tool 02: Long-only direct indexing
Direct indexing replicates an index with individually held stocks, then harvests losses at the position level as individual names dip, even in years the index rises. The harvested losses offset gains elsewhere, including gains from selling down a concentrated position. The category has become enormous: $864 billion at year-end 2024, crossing roughly $1 trillion in mid-2025, with Parametric ($253B) and BlackRock's Aperio ($111B) controlling the institutional end and the top five providers holding ~87% of assets.
What the evidence supports
The academic benchmark is Chaudhuri, Burnham, and Lo's study in the Financial Analysts Journal: a tax-loss-harvesting overlay on the largest 500 U.S. stocks from 1926 to 2018 produced an average tax alpha of 1.08% per year before transaction costs, falling to 0.82% once wash-sale constraints were enforced. Vanguard's research brackets the range at roughly 0.5% to 1.3% for typical investors. Wealthfront's first-year results for S&P 500 Direct reported an estimated after-tax benefit of 4.5% of portfolio value, earned in an unusually volatile twelve months, with a cross-client range of 0.7% to 7.7%.
The ossification problem
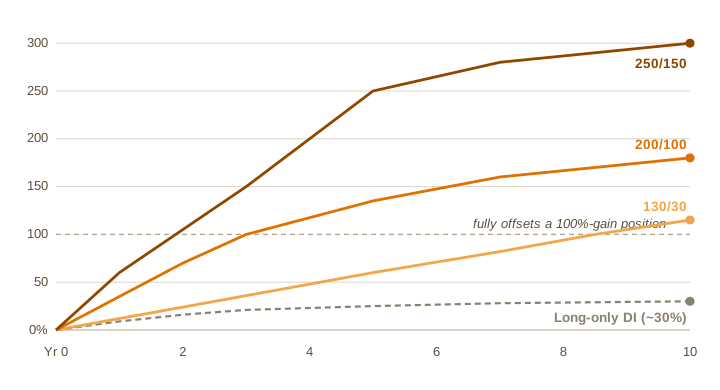
The critical limitation for concentrated clients is decay. Loss harvesting is fueled by positions trading below cost basis. As the portfolio appreciates, fewer positions sit at a loss, and the engine stalls. AQR's research quantifies the ceiling: cumulative net losses from long-only direct indexing taper within the first few years and top out around 30% of initially invested capital on average. Practitioner data agrees: roughly 21% cumulative by year three, about 28% by year seven, then exhaustion.
Now put that against the client's actual problem. A $5M position with 90% embedded gain contains $4.5M of unrealized gains. A $5M direct-indexing sleeve funded with new cash will generate perhaps $1.5M of cumulative losses over a decade, most of it in the first three years. Useful, genuinely. But it can never fully unlock the position, and this is the precise gap the long/short extension (Tool 03) was built to fill.
Figure 2. Cumulative harvested losses as a share of initial capital, stylized from AQR (2023), Kitces (2026), and Wealthspire (2025) data points.
Provider economics: long-only direct indexing
| Provider | Annual fee | Minimum | Channel | Notes |
|---|---|---|---|---|
| Wealthfront S&P 500 Direct | 0.09% | $5,000 | Direct | Launched Dec 2024; lowest published fee |
| Frec | 0.09-0.10% | $20,000-$50,000 | Direct | Minimums vary by index |
| Parametric Custom Core | ~0.20-0.35% | ~$250,000 | Advisor | Category inventor (1992); $253B AUM |
| Vanguard Personalized Indexing | 0.20% | $250,000 | Advisor | Most conservative tax-alpha research |
| Schwab Personalized Indexing | 0.40% / 0.35% | $100,000 | Both | 0.35% above $2M |
| Fidelity Managed FidFolios | 0.40% | $5,000 | Direct | Retail wrapper of Fidelity SMA machinery |
Insight: direct indexing is a complement, not a solution. For the concentrated client, long-only DI does three jobs well: absorbing new cash tax-efficiently, generating first-year losses (often 3-8% of the sleeve) to pair against modest trimming, and serving as the destination portfolio after another tool completes. The job it does badly is unlocking the position itself: a ~30% lifetime loss ceiling cannot neutralize a 90%-gain position of equal size. Long-only DI is the landing zone, not the crane.
Tool 03: Tax-aware long/short, the loss factory
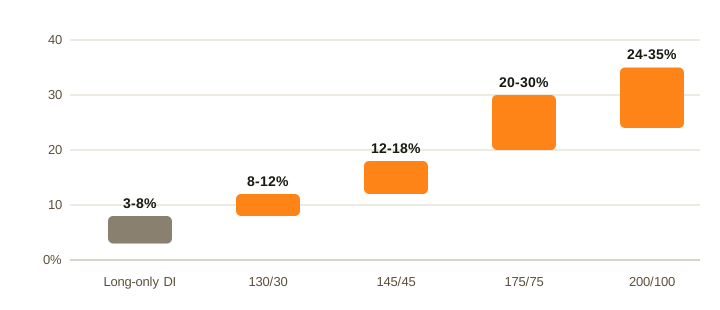
If long-only direct indexing is a well that runs dry, the long/short extension is a well that keeps refilling. Alongside the index sleeve, the manager runs a levered extension, e.g. 130% long and 30% short, up through 250/150 and beyond. The long and short books are index-neutral in aggregate, but each side continuously produces positions trading at a loss: shorts lose in up markets, longs lose in down markets. The manager harvests whichever side is losing, defers whatever is gaining, and the engine generates net realized losses through every market regime.
The category has scaled explosively: roughly $150 billion by mid-2026, with AQR around $69 billion in tax-aware strategies and Quantinno at $48 billion across more than 10,000 accounts, up from under $5 billion each in early 2024.
What the leverage buys
AQR's published research (Krasner and Sosner) shows tax-aware long/short strategies realizing cumulative net capital losses exceeding 100% of invested capital within the first three years at higher leverage tiers, while still delivering pre-tax alpha, with loss-taking trades running at 2.4x the frequency of a tax-agnostic version of the same strategy. The same paper contains the nuance most marketing omits: a large share of the measured benefit is gain deferral rather than loss harvesting per se, which matters for clients who cannot hold to a step-up.
Figure 3. Estimated annual net loss generation by leverage tier, per published provider estimates (2026).
The unwind math for concentrated positions
Pair the loss factory with a schedule of sales: each quarter, sell a tranche of the concentrated stock sized to the losses the extension generated, so the diversification proceeds with little or no net tax. The most rigorous study (Malkin, Selwitz, Cai, and Goldberg, Journal of Asset Management, 2025) ran 380 backtests on the top-20 S&P 500 performers, positions with average cumulative gains above 5,000%. A 200/100 long/short overlay reduced the concentrated position below 5% of the portfolio within 10 years in 100% of trials, net of trading, financing, and management costs, adding an estimated 1.34% per year of after-tax active return versus naive approaches. A 130/30 configuration achieves tax-neutral diversification in roughly 8.5 years. Kitces' rule of thumb: $1M of appreciated stock plus a $1M 200/100 sleeve accumulates about $1M of losses within three years, enough to fully liquidate a 100%-gain position.
A 200/100 overlay took positions with 5,000% embedded gains below 5% of the portfolio within ten years, in every one of 380 backtests.What it costs, honestly
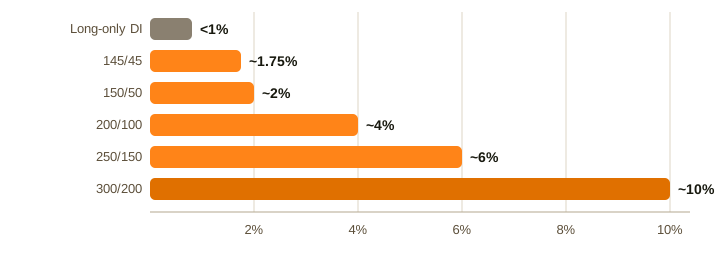
Three cost layers stack: the management fee (published range 0.50-1.30% at direct-to-consumer providers; undisclosed but comparable in advisor channels), the net financing spread on the extension (typically 80-120 bps of the extension, roughly 0.3-1.4% of account value depending on leverage), and elevated turnover (Elm Wealth estimates ~400% annually). All-in costs run from about 0.67% to north of 2.5% per year. Financing costs are generally deductible, which softens the after-tax bite.
Figure 4. Tracking error by leverage tier: the other side of the ledger.
Provider landscape: tax-aware long/short
| Provider | Scale | Minimum | Fee | Notes |
|---|---|---|---|---|
| AQR Flex | ~$69B tax-aware | ~$1-3M | Undisclosed | Advisor channel; leverage to 300/200 |
| Quantinno DEALS | ~$48B, 10,600+ accounts | ~$1M+ | Undisclosed | DEALS Exchange built for concentrated unwinds |
| Aperio (BlackRock) | $111B (all DI) | ~$1M+ | ~0.55% (130/30) | Strongest published unwind research |
| Cache Long/Short (Nuveen) | n/d | $1M | 0.50-1.00% + 0.17-0.57% financing | 0.20% Exit tier for slow unwinds |
| Frec Long/Short | n/d | $100K-$500K | 0.50-1.30% + 0.38-1.43% financing | Lowest entry minimum in category |
| Neuberger / Natixis / Invesco / GSAM | n/d | $500K-$1M | Undisclosed | The 2025-26 entrant wave |
The custodian crackdown, the story of 2026. December 2025: Fidelity pauses onboarding of new tax-aware long/short SMA accounts. February 2026: the pause becomes indefinite. April 23, 2026: Schwab caps new enrollments at 200/100 leverage, sets minimums of $1M (Reg T) / $3M (portfolio margin), and limits long/short strategies to 30% of an RIA's Schwab-custodied assets. May 1, 2026: Fidelity raises platform and borrow costs; reported borrow moves from ~60 bps to over 150 bps. Two implications: capacity is now a real constraint (existing accounts are grandfathered, which favors clients who move early), and counterparty terms are revealed as changeable at will.
The counterargument: Elm Wealth's fee-drag simulation (April 2026). Simulating a concentrated-position unwind through a levered long/short program, Elm found the strategy sold down the position in about three years on average, but after 1.25% combined fees and ~400% annual turnover, the 20-year after-tax return (2.05%/yr) trailed simply selling everything on day one and buying an index fund (2.16%/yr). Roughly $2.7M of cumulative fees were paid to avoid roughly $3.7M of capital gains tax, and even granting 0.5% of annual manager alpha, the strategy beat the sell-now alternative only 55% of the time. Elm sells a competing approach, so read it as an informed adversarial brief. But its discipline is right: model the sell-now alternative honestly, including state taxes and horizon, before recommending the machine.
Risk register for the file. Harvested losses lower basis one-for-one, building a deferred-gain liability. Deleveraging out of a high-leverage program takes years and realizes gains on the way down. Short squeezes and factor drawdowns are real (AQR's equity market neutral strategy lost roughly 40% peak-to-trough in 2018-2020 while the S&P rose). Platform terms can change mid-flight, and there is IRS and economic-substance attention to the category: the long and short books must be a real investment strategy, not a paper loss generator.
Tool 04: Collars and prepaid variable forwards
Hedging tools do not diversify the position. They cap its downside, and in monetized form they turn it into spendable cash today, all while the deferral clock keeps running. For the right client, usually one who needs liquidity but cannot or will not sell, they are indispensable.
The collar. Buy an out-of-the-money put, sell an out-of-the-money call, same expiry. In the standard "zero-cost" construction the call premium fully funds the put; a 90% put / 110% call over one to three years is the workhorse structure. Execution runs from listed options through Cboe FLEX options to OTC dealer contracts (historically $5-10M minimums at bulge-bracket desks, now advertised around $2-3M at newer platforms). The collar's quiet superpower is monetization: once the downside is floored, lenders will advance typically 70-90% of position value at rates around SOFR plus 2-6%.
The prepaid variable forward. A PVF bundles the collar and the loan into one OTC contract: the dealer hands the client typically 75-85% of the position's value upfront, and at maturity (usually 2-5 years) the client delivers a variable number of shares. Under Rev. Rul. 2003-7, properly structured PVFs achieve open-transaction treatment: no sale today, gain deferred to settlement. The financing cost hides in the discount: in one published example, a two-year PVF with an 80-160% collar implied about 6% of total cost, leaving 74% net liquidity.
The tax minefield. Constructive sales (IRC 1259): hedge too tightly and the IRS treats the hedge as a sale today; practice convention keeps the put no higher than ~90-95% and the call no lower than ~110%. Straddle rules (IRC 1092): a collar on appreciated stock defers hedge losses, capitalizes carrying costs, and suspends the stock's holding period. The qualified covered call exception dies when you add a put. Dividends: a collared position can quietly convert qualified dividends to ordinary rates. And the share-lending landmine: pairing a PVF with a share-lending arrangement to the counterparty destroys the deferral entirely; in the Anschutz case this accelerated a gain north of $100 million.
Reality check: for executives, the hedging conversation is usually over before it starts. Roughly 84% of large-cap S&P 500 companies prohibit hedging of company shares by executives, and over 90% restrict pledging, which also blocks the monetization loan. For most current executives and directors, collars and PVFs are off the table by policy, not by tax law. The compliant menu shrinks to 10b5-1 selling, gifting, and the pooled vehicles. Hedging tools come back into play after separation from the company.
Tool 05: Charitable remainder trusts
The CRT is the oldest large-position exit in the book, and for the genuinely charitable client it remains among the most efficient. The donor contributes appreciated stock to an irrevocable trust, the trust sells it without recognizing gain, reinvests diversified, and pays the donor an income stream for life or a term of up to 20 years. The remainder passes to charity, generating a partial upfront deduction.
The constraints are statutory: the payout rate must be between 5% and 50%, the present value of the charitable remainder must be at least 10% of funding value, and CRATs face the 5% probability-of-exhaustion test. Most trusts are set at 5-8% payouts. Distributions are taxed under the four-tier "worst-in, first-out" system, so the deferred gain reaches the donor spread across years of distributions.
Costs: $3,000-$10,000 to establish a standard trust (complex cases to $25,000), plus ongoing administration at roughly 0.5-1.1% of assets annually, and annual Form 5227 compliance.
Fit test: three things must be simultaneously true: real charitable intent, a desire for lifetime income rather than lump liquidity, and a large embedded gain worth spreading. Where heirs are the priority, pair with a wealth-replacement life insurance trust. Note the 2026 OBBBA changes (0.5% AGI floor on charitable deductions, 35% cap on the benefit for top-bracket donors) modestly trim the upfront deduction.Tool 06: Section 351 exchange ETFs
In a Section 351 exchange, investors contribute appreciated securities in-kind to seed a newly launching ETF, tax-deferred, with carryover basis. Once inside, the ETF diversifies and rebalances using the in-kind create/redeem mechanism, so future changes generate no distributed gains. Cambria's TAX (December 2024) was the first advisor-facing launch; by March 2026 roughly 77 U.S. ETFs had been seeded this way with nearly $17 billion, with Alpha Architect running a rolling series at minimums of $150,000 (Schwab) to $1M, and Cambria's TAX charging 0.59%.
Here is the catch the category's marketing tends to whisper: the contributed basket must already be diversified. The RIC diversification tests apply at contribution: no single position over 25% of contributed value, top five positions under 50%. A client whose problem is one stock at 80% of the portfolio cannot fix it with a 351 exchange; the concentrated name can ride along at up to 25% of a broader contribution, but the concentration itself must be solved elsewhere first.
The right mental model: 351 ETFs are a superb graduation vehicle. After a long/short unwind or years of staged selling has brought the position under 25%, a 351 seed converts the whole untidy, appreciated, multi-lot portfolio into a single clean ETF position, tax-deferred, cheap to hold, and step-up eligible.
Tool 07: Exchange funds, in depth
The exchange fund is the only tool in this kit that solves the headline problem directly: it converts a single concentrated stock into a diversified portfolio, immediately, with no sale and no tax. Multiple investors contribute their appreciated positions into a partnership; each receives units of the pooled, diversified whole. IRC 721(a) makes the contribution non-recognition. The client walks in with one stock and walks out, economically, with an index.
The structure is a creature of two tax rules, and both show up in the product's quirks.
The 20% qualifying-asset sleeve. Section 721(b) denies non-recognition to contributions into an "investment company," defined by an 80% test over stocks and securities. Qualifying assets like real estate are excluded from that test, so every exchange fund holds at least 20% of gross assets in qualifying assets, traditionally institutional real estate partnerships, typically financed with borrowings of roughly 25% of net assets. Publicly traded REITs do not qualify. This sleeve is a statutory tollbooth: it carries leverage, and when borrowing costs exceed the sleeve's income yield it drags on returns.
The 7-year clock. Sections 704(c)(1)(B) and 737 recapture the deferred gain if contributed property is redistributed within seven years, so the funds impose a seven-year hold. Redeem early and you get your own stock back, keeping the deferral but forfeiting the diversification, usually minus a 1-2% fee. Redeem after seven years and you receive a diversified basket in-kind with your original basis carried over. No tax is due until you sell those shares, and if you never do, the step-up at death eliminates the deferred gain entirely.
The competitive landscape: legacy giants and a price war
For decades this was a two-firm market. Eaton Vance obtained the enabling IRS ruling in 1975 and built the category (its Belvedere master portfolio reached $19.9B in 2008); Goldman Sachs built the modern franchise. Then in 2024 a fintech entrant repriced the category, and in 2025 a second entrant claimed to zero it out.
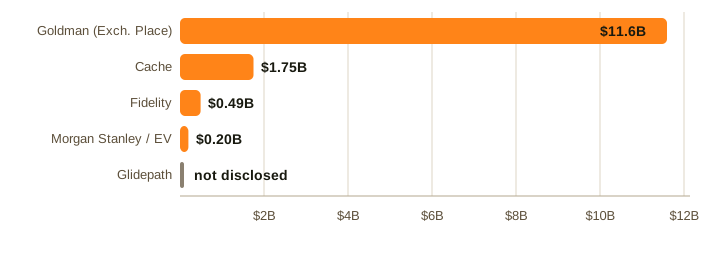
Figure 5. Exchange fund scale by provider, disclosed assets, mid-2026. Form D totals understate true AUM.
The competitor field, August 2026 (from SEC Form D filings and provider disclosures):
| Provider | Minimum | Eligibility | Fee | Liquidity | Scale |
|---|---|---|---|---|---|
| Goldman Exchange Place | ~$500K-$1M (cited) | QP | ~1-2% (cited) | 7-year | ~$11.6B family |
| Morgan Stanley / Eaton Vance | $1,000,000 | QP | Not public | 7-year | $199M current |
| Fidelity Exchange Fund | $250,000 | QP | 0.54% + admin, servicing, 1.5% placement | 3-yr lock; 7-yr basket | $487M |
| Cache | $100,000 | AI or QP | 0.40-0.95%; 0.25% after yr 7 | Access 2-yr; Flagship none | $1.5B+ platform |
| Glidepath | $100,000 | QP | 0% | 7 years + 1 day | n/d |
Three storylines matter here. First, the price collapse: legacy all-in costs commonly cited at 1-2% have been undercut by an order of magnitude, and minimums fell from seven figures to $100,000. Second, the incumbents are not standing still: Goldman is raising its next fund and Fidelity's is doubling annually, though its layered fee stack reads like the structure the entrants are attacking. Third, fees now define the category's second act: when the mechanics are identical (721 non-recognition, seven-year clock, diversified exit basket), the all-in cost becomes the primary differentiator, and buyers should pressure-test every fee line: management, fund operating expenses, sleeve economics, placement, servicing, and early-redemption.
Checklist: eight questions to ask any exchange fund.
- Economics: What is the all-in cost across every line: management fee, fund operating expenses, qualifying-asset sleeve fees, placement or servicing fees, early redemption fees? How does the manager sustain the business at the stated fee level?
- Filings: Where is the Form D, and what do "total sold" and investor count show? Who audits the fund?
- Tracking: What benchmark, what realized correlation, and how is the equity sleeve rebalanced given contributed stock cannot be freely sold?
- The 20% sleeve: What qualifying assets, how much leverage, at what borrowing cost, and what happens to the sleeve at redemption?
- Concentration intake: What are the position limits on any single contributed name, and how tech-heavy is the pool?
- Redemption mechanics: Exactly what do I receive before and after year seven, how many names, and how is basis allocated?
- Counterparty durability: Fund life, manager balance sheet, and what happens to my units if the sponsor fails before year seven?
- Capacity and cadence: How often are exchange windows, and is my stock currently accepted?
The honest caveats (Kitces, April 2026). Deferral, not elimination: the basket you receive at year seven carries your original basis. Performance drag can erase the benefit: if the fund underperforms a sell-and-reinvest alternative by about 2% per year, the deferral advantage is fully consumed within roughly a decade. You inherit the pool: your diversification is whatever everyone else contributed. And seven years is seven years: early exit returns your own concentrated stock, plus a fee, minus the diversification you came for.Part III: The charitable and niche adjacents
Outright gifts of appreciated stock. The single most tax-efficient disposition in existence: a full fair-market-value deduction (up to 30% of AGI for gifts to public charities) and the capital gain permanently disappears. Every charitably inclined concentrated client should fund their giving with low-basis shares, never cash.
Donor-advised funds. The same tax result with granting decisions decoupled in time. The market has voted: 67% of contributions to Fidelity Charitable in 2024 were non-cash assets. For a client with a concentrated position and any philanthropic pulse, "bunch several years of giving into a DAF with low-basis stock" is usually the first trade in the plan.
Opportunity zone funds. Sell the stock, reinvest only the gain into a QOF within 180 days. The OBBBA made the program permanent: for investments after December 31, 2026, a rolling five-year deferral, a 10% basis step-up (30% for rural funds), and tax-free appreciation after a ten-year hold. The honest framing: this swaps one concentrated public position for illiquid real estate or operating-business risk.
QSBS: when the cheapest strategy is just selling. If the concentrated position is original-issue C-corp founder or early-employee stock, check IRC 1202 before anything else. QSBS carries a gain exclusion of up to $10M per issuer (old rules) or $15M for stock acquired after July 4, 2025, with a new tiered schedule: 50% exclusion at 3 years, 75% at 4, 100% at 5. A founder with $12M of fully qualified QSBS should usually not be in an exchange fund or a long/short program at all: outright sale may be federally tax-free up to the cap. This is the one client type for whom the entire deferral industry is often irrelevant.
Part IV: The master comparison
Figure 6. Annual running cost by strategy in basis points per year. Excludes advisor fees, taxes, and opportunity costs.
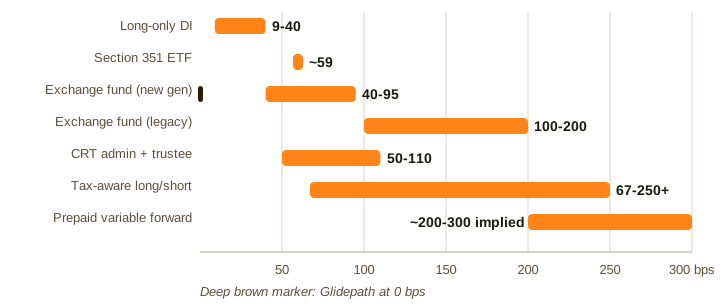
The complete toolkit, side by side:
| Strategy | Diversifies? | Liquidity | Minimum | Timeline | Insider-safe? |
|---|---|---|---|---|---|
| Staged selling / 10b5-1 | Gradually | Full | None | 1-10 yrs | Yes |
| Long-only direct indexing | No | Partial | $5K-$250K | Ongoing | Yes |
| Tax-aware long/short | Over 3-10 yrs | As sold | $100K-$3M | 3-10 yrs | Yes |
| Collar / PVF | No (hedges only) | 70-90% LTV | ~$2-10M | 1-5 yrs | Usually barred |
| Charitable remainder trust | Yes | Income stream | ~$500K practical | Life / 20 yrs | Yes |
| Section 351 ETF | No (needs diversified basket) | ETF shares | $150K-$1M | None post-seed | Yes |
| Exchange fund | Immediately | Locked ~7 yrs | $100K-$1M | 7 years | Generally yes |
| Gift / DAF | For gifted shares | None to donor | None | Immediate | Yes |
No single tool wins. The plans that work are stacks: a DAF tranche for this decade's giving, a long/short engine grinding the position down, an exchange fund or 351 seed as the terminal vehicle, and a 10b5-1 plan running underneath it all.
Part V: Three clients, three stacks
The tech VP, still inside. $6M employer stock, 75% of net worth, 92% gain, age 44. Hedging is barred by company policy; cash need is moderate; horizon is long. The stack: a 10b5-1 plan selling ~$60K/month; a $2M exchange fund contribution for immediate diversification on a seven-year clock; sale proceeds landing in a 145/45 long/short sleeve whose losses shelter an accelerated sale schedule in years 2-5; annual giving switched to low-basis shares via a DAF. Why not a collar? Policy prohibition. Why not sell faster? Rule 144 volume limits and signaling risk.
The founder, post-exit. $14M acquirer stock from a merger, no QSBS, age 52, wants a house and a fund commitment. The stack: QSBS analysis first (here it fails); a PVF on $5M at ~80% advance for ~$4M cash now; $7M into a 200/100 long/short program modeled to cover full liquidation within ~3-4 years, which then also absorbs the PVF settlement gain; $2M of lowest-basis shares to a CRT paying 6%. Why not an exchange fund? The horizon to spend is under seven years for most of the money.
The legacy holder. $2.5M utility stock, a 30-year position, 95% gain, age 71, no cash need. The classic step-up candidate. The stack: reframe the goal (the deferred gain dies with the holder, so the enemy is single-name risk between now and then, not the tax); an exchange fund for $1.5M, which a $100K-minimum fund makes feasible at this size for the first time; $500K to a DAF over five years; the remainder held. Why not long/short? Complexity, leverage, and a fee drag that serves no purpose when the step-up already zeroes the tax.
The closing argument
The advisor's tax toolkit used to be genuinely incomplete: direct indexing that stalls, collars that hedge without diversifying, exchange funds gated at seven figures and priced at 2%, trusts that require giving the money away. The last three years changed the inventory. Long/short engines now manufacture losses at industrial scale (with custodians actively rationing access), exchange fund minimums fell 90% while fees fell by more than half, and 351 seeds created a clean terminal vehicle for whatever the unwind produces.
What has not changed is the arithmetic of the client's dilemma. Roughly 40% of stocks eventually suffer a catastrophic, unrecovered decline, and the market's entire premium comes from a 4% sliver of extreme winners. Every quarter a concentrated position sits untouched, the client is making the single largest active bet of their financial life, usually by default. The toolkit above exists so that the advisor never again has to present the false choice between a seven-figure tax bill and doing nothing. The stalemate is now a sequencing problem, and sequencing problems have answers.
Compiled August 2026 from SEC filings, peer-reviewed research, and provider disclosures. Educational material for financial professionals, not tax or legal advice.